The figure shows a graph of the position x of two cars,C and D,as a function of time t. 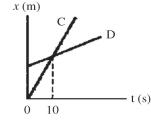
According to this graph,which statements about these cars must be true? (There could be more than one correct choice. )
A) The magnitude of the acceleration of car C is greater than the magnitude of the acceleration of car D.
B) The magnitude of the acceleration of car C is less than the magnitude of the acceleration of car D.
C) At time t = 10 s,both cars have the same velocity.
D) Both cars have the same acceleration.
E) The cars meet at time t = 10 s.
Correct Answer:
Verified
Q42: A motorist travels 160 km at 80
Q43: Which of the following graphs represent an
Q44: Which of the following graphs represent an
Q45: The area under a curve in a
Q46: A motorist travels for 3.0 h at
Q49: If you are driving 72 km/h along
Q51: An airplane travels at 300 mi/h south
Q52: A light-year is the distance that light
Q155: If the velocity versus time graph of
Q156: If the velocity versus time graph of
Unlock this Answer For Free Now!
View this answer and more for free by performing one of the following actions

Scan the QR code to install the App and get 2 free unlocks

Unlock quizzes for free by uploading documents