The graph in the figure shows the position of a particle as it travels along the x-axis.What is the magnitude of the average velocity of the particle between t = 1.0 s and t = 4.0 s? 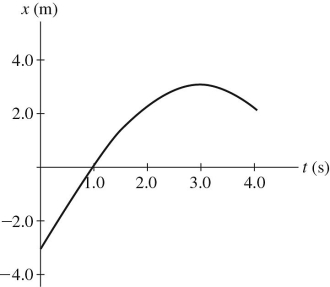
A) 0.25 m/s
B) 0.50 m/s
C) 0.67 m/s
D) 1.0 m/s
E) 1.3 m/s
Correct Answer:
Verified
Q124: The figure shows a graph of the
Q125: Abby throws a ball straight up and
Q126: Two identical objects A and B fall
Q127: Car A is traveling at twice the
Q128: The figure shows a graph of the
Q130: A car moving initially with speed v0
Q131: In the absence of air resistance,a ball
Q132: To determine the height of a flagpole,Abby
Q133: Two cars are traveling at the same
Q134: Abby throws a ball straight up and
Unlock this Answer For Free Now!
View this answer and more for free by performing one of the following actions

Scan the QR code to install the App and get 2 free unlocks

Unlock quizzes for free by uploading documents