The graph in the figure shows the x component F of the net force that acts for 10 s on a 100-kg crate.What is the change in the momentum of the crate during the 10 s that this force acts? 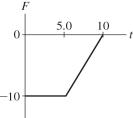
A) -100 kg ∙ m/s
B) -25 kg ∙ m/s
C) 75 kg ∙ m/s
D) -75 kg ∙ m/s
E) 25 kg ∙ m/s
Correct Answer:
Verified
Q52: A 0.140-kg baseball is dropped and reaches
Q53: Two astronauts,of masses 60 kg and 80
Q54: Astronaut Jennifer's lifeline to her spaceship comes
Q55: A golf club exerts an average horizontal
Q56: A 14-cm diameter champagne bottle rests on
Q58: A dinner plate falls vertically to the
Q59: A dinner plate falls vertically to the
Q60: A firecracker breaks up into two pieces,one
Q61: A 1000-kg whale swims horizontally to the
Q62: A 1000-kg whale swims horizontally to the
Unlock this Answer For Free Now!
View this answer and more for free by performing one of the following actions

Scan the QR code to install the App and get 2 free unlocks

Unlock quizzes for free by uploading documents