Figure 3.7 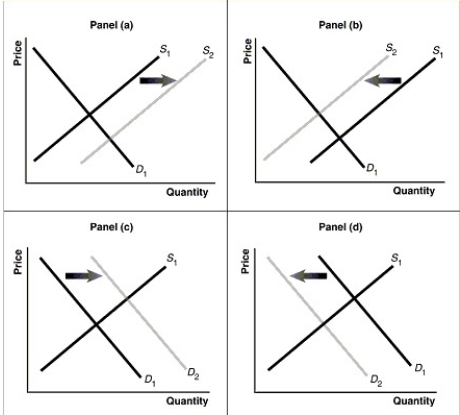
-Refer to Figure 3.7.Assume that the graphs in this figure represent the demand and supply curves for used movie tickets, an inferior good.Which panel describes what happens in this market as a result of a decrease in income?
A) Panel (a)
B) Panel (b)
C) Panel (c)
D) Panel (d)
Correct Answer:
Verified
Q146: Figure 3.7 Q148: Assume that the price for air conditioner Q150: Which of the following would cause both Q153: Table 3.1 Q155: Let D = demand, S = supply, Q163: Assume that the hourly price for the Q174: Draw a supply and demand graph showing Unlock this Answer For Free Now! View this answer and more for free by performing one of the following actions Scan the QR code to install the App and get 2 free unlocks Unlock quizzes for free by uploading documents![]()
![]()

