Table 5.4 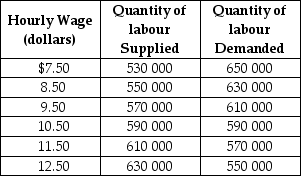 Table 5-4 shows the demand and supply schedules for labour market in the city of Pixley.
-Refer to Table 5.4.Suppose that the quantity of labour supplied decreases by 80 000 at each wage level.What are the new free market equilibrium hourly wage and the new equilibrium quantity of labour?
A) W = $8.50; Q = 550 000
B) W = $12.50; Q = 550 000
C) W = $8.50; Q = 630 000
D) W = $11.50; Q = 610 000
Correct Answer:
Verified
Q100: Which statement is true when a competitive
Q102: Table 5.4 Q103: Table 5.4 Q104: Table 5.4 Q106: Of what is rent control an example? Q107: Figure 5.5 Q109: Economists refer a market where buying and Unlock this Answer For Free Now! View this answer and more for free by performing one of the following actions Scan the QR code to install the App and get 2 free unlocks Unlock quizzes for free by uploading documents![]()
![]()
![]()
A)A![]()

