Figure 7.5 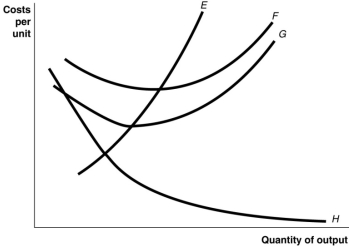
-Refer to Figure 7.5.Identify the curves in the diagram.
A) E = average fixed cost curve; F = variable cost curve; G = total cost curve, H = marginal cost curve
B) E = marginal cost curve; F = total cost curve; G = variable cost curve, H = average fixed cost curve
C) E = average fixed cost curve; F = average total cost curve; G = average variable cost curve, 
D) E = marginal cost curve; F = average total cost curve; G = average variable cost curve; 
Correct Answer:
Verified
Q171: Figure 7.4 Q173: If average total cost is $50 and Q174: If the total cost of producing 20 Q175: Table 7.7 Q177: If a firm produces 20 units of Q178: What is the formula for total fixed Q179: Suppose you have just opened a store Unlock this Answer For Free Now! View this answer and more for free by performing one of the following actions Scan the QR code to install the App and get 2 free unlocks Unlock quizzes for free by uploading documents![]()
![]()

