Figure 7.8 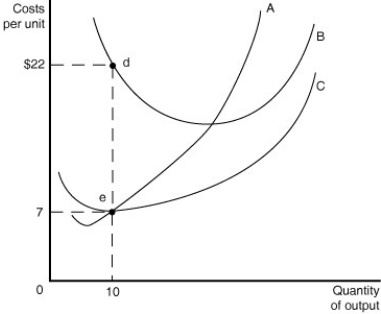
-Refer to Figure 7.8 above to answer the following questions.
a.Identify the curves in the diagram.
A ________
B ________
C ________
b.What is the numerical value of fixed cost when the quantity of output = 10?
c.What is the numerical value of variable cost when the quantity of output = 10?
d.What is the numerical value of total cost when the quantity of output = 10?
e.What is the numerical value of average fixed cost when the quantity of output = 10?
f.What is the numerical value of average total cost when the quantity of output = 10?
g.On the graph identify the area that represents the total variable cost of production when the quantity of output = 10.
h.On the graph identify the area that represents the fixed cost of production when the quantity of output = 10.
__________________________________________________________________________________________________________________________________________________________________________________________
Correct Answer:
Verified
View Answer
Unlock this answer now
Get Access to more Verified Answers free of charge
Q201: Over the past twenty years, the number
Q205: Explain how the listed events (a-d)would affect
Q207: Suppose the total cost of producing 40
Q208: What is the minimum efficient scale?
A)The level
Q208: Use the general relationship between marginal and
Q212: If production displays economies of scale, the
Q231: If production displays diseconomies of scale, the
Q237: When a firm's long-run average cost curve
Q239: Which of the following is a reason
Q240: If, when a firm doubles all its
Unlock this Answer For Free Now!
View this answer and more for free by performing one of the following actions

Scan the QR code to install the App and get 2 free unlocks

Unlock quizzes for free by uploading documents