Figure 7.11 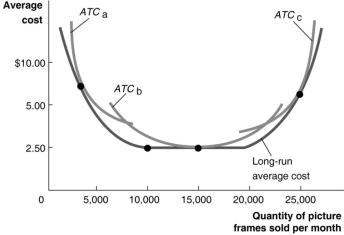 Figure 7.11 illustrates the long-run average cost curve for a firm that produces picture frames.The graph also includes short-run average cost curves for three firm sizes: ATCa, ATCb and ATCc.
-Refer to Figure 7.11.Constant returns to scale
A) occur for output rates greater than 5000 picture frames.
B) occur between 5000 and 20 000 picture frames per month.
C) occur between 10 000 and 20 000 pictures frames per month.
D) will shift the long-run average cost curve downward.
Correct Answer:
Verified
Q221: In the long run,
A)the firm's fixed costs
Q226: If a firm's long-run average total curve
Q228: What is the difference between "diminishing marginal
Q230: When do diseconomies of scale occur?
A)When long-run
Q232: When do economies of scale occur?
A)When a

