Figure 7.11 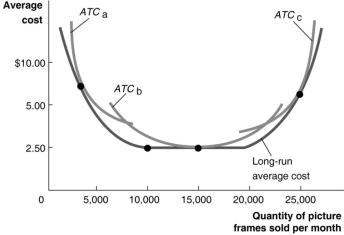 Figure 7.11 illustrates the long-run average cost curve for a firm that produces picture frames.The graph also includes short-run average cost curves for three firm sizes: ATCa, ATCb and ATCc.
-Refer to Figure 7.11.In the short run, if the firm sells fewer than 5000 picture frames per month,
A) it should produce with the scale of operation associated with ATCa.
B) it should produce with the scale of operation associated with ATCb.
C) it should produce with the scale of operation associated with ATCc.
D) it will experience constant returns to scale.
Correct Answer:
Verified
Q221: In the long run,
A)the firm's fixed costs
Q228: What is the difference between "diminishing marginal
Q236: If an airport decides to expand by
Q237: Figure 7.10 Q239: Figure 7.11 Q241: The marginal rate of technical substitution is Q242: Assume that you observe the long-run average Unlock this Answer For Free Now! View this answer and more for free by performing one of the following actions Scan the QR code to install the App and get 2 free unlocks Unlock quizzes for free by uploading documents![]()
![]()
A)the

