Multiple Choice
Figure 7.12 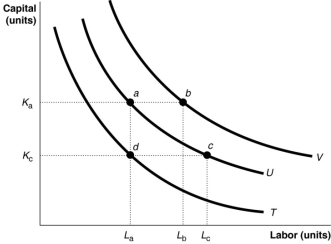
-Refer to Figure 7.12.The movement from isoquant T to isoquant U depicts
A) a change in preferences with regards to input usage.
B) an increase in the cost of production.
C) an increase in output.
D) an increase in labour usage holding capital and output constant.
Correct Answer:
Verified
Related Questions

