Figure 7.13 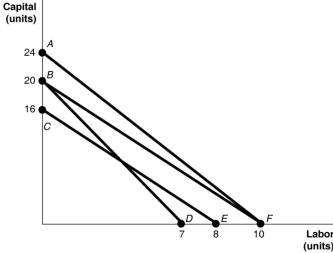
-Refer to Figure 7.13.The lines shown in the diagram are isocost lines.Which of the following shows a decrease in the price of capital while the price of labour remains unchanged?
A) The movement from AF to BF
B) The movement from BF to AF
C) The movement from BF to BD
D) The movement from BF to CE
Correct Answer:
Verified
Q273: Figure 7.13 Q275: Figure 7.14 Q276: Figure 7.12 Q284: The rate at which a firm is Q288: An expansion path shows Q294: The typical shape of an isoquant is Q309: A change in the slope of an Q312: The slope of a typical isoquant is Q319: The marginal rate of technical substitution is Q323: What is an isocost line? What is Unlock this Answer For Free Now! View this answer and more for free by performing one of the following actions Scan the QR code to install the App and get 2 free unlocks Unlock quizzes for free by uploading documents![]()
![]()
![]()
A)the level of sales
A)convex

