Figure 7.13 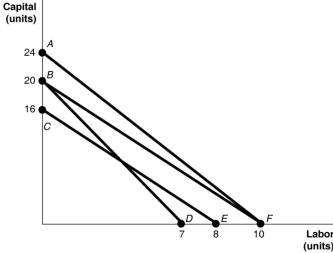
-Refer to Figure 7.13.The lines shown in the diagram are isocost lines.Which of the following shows an increase in the firm's total cost while the price of labour and capital remain unchanged?
A) The movement from CE to BF
B) The movement from CE to AF
C) The movement from BD to AF
D) The movement from BD to CE
Correct Answer:
Verified
Q255: Which of the following statements explains the
Q262: Figure 7.12 Q263: Figure 7.13 Q265: Figure 7.14 Q266: Suppose the price of capital and labour Q267: What are economies of scale? What are Q268: A U-shaped long-run average cost curve implies Q269: Higher isocost lines correspond to higher Q272: What is minimum efficient scale? What is Q276: The absolute value of the slope of Unlock this Answer For Free Now! View this answer and more for free by performing one of the following actions Scan the QR code to install the App and get 2 free unlocks Unlock quizzes for free by uploading documents![]()
![]()
![]()
A)profits.
B)total costs

