Multiple Choice
Figure 8.5 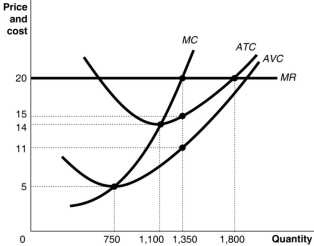 Figure 8.5 shows cost and demand curves facing a typical firm in a constant-cost, perfectly competitive industry.
-Refer to Figure 8.5.If the market price is $20, the amount of the firm's profit is
A) $5400
B) $6750
C) $8100
D) $16 200
Correct Answer:
Verified
Related Questions
Q111: Table 8.3 ![]()

