Multiple Choice
Figure 9.4 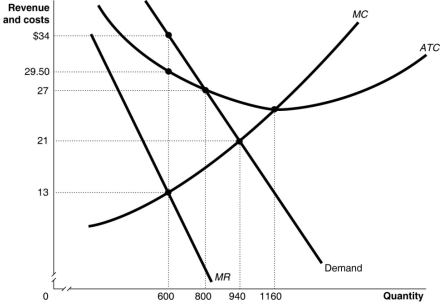 Figure 9.4 shows the demand and cost curves for a monopolist.
-Refer to Figure 9.4.The amount of the monopoly's total revenue us
A) $21 600
B) $20 400
C) $19 740
D) $7800
Correct Answer:
Verified
Related Questions
Q92: Figure 9.3 Q93: Table 9.2 Q94: Table 9.2 Q95: Figure 9.4 Q96: Figure 9.4 Q98: Figure 9.5 Q100: Which of the following statements applies to Q101: If a monopolist's price is $50 at Q102: Figure 9.6 Q112: A monopoly firm's demand curve Unlock this Answer For Free Now! View this answer and more for free by performing one of the following actions Scan the QR code to install the App and get 2 free unlocks Unlock quizzes for free by uploading documents![]()
![]()
![]()
![]()
![]()
![]()
![]()
A)is the same

