Figure 9.8 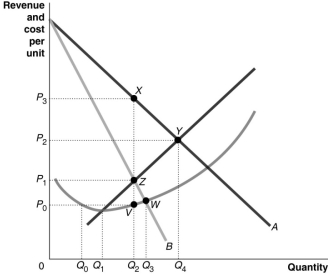 Figure 9.8 reflects the cost and revenue structure for a monopoly that has been in business for a very long time.
-Refer to Figure 9.8.Use the figure above to answer the following questions.
a. Identify the curves labelled A and B.Identify the curve which contains both point Y and point Z.Identify the curve which contains both point V and point W.
b.What is the profit-maximising quantity and what price will the monopolist charge?
c.What area represents total revenue at the profit-maximising output level?
d.What area represents total cost at the profit-maximising output level?
e.What area represents profit?
f.What is the profit per unit (average profit)at the profit-maximising output level?
g.If this industry was organised as a perfectly competitive industry, what would be the profit-maximising price and quantity?
h.What area represents the deadweight loss as a result of a monopoly?
__________________________________________________________________________________________________________________________________________________________________________________________
Correct Answer:
Verified
View Answer
Unlock this answer now
Get Access to more Verified Answers free of charge
Q121: Figure 9.9 Q122: To what does market power refer? Q123: Figure 9.10 Q124: Economic efficiency in a free market occurs Q125: Explain whether a monopoly that maximises profit![]()
A)The ability![]()

