Figure 9.16 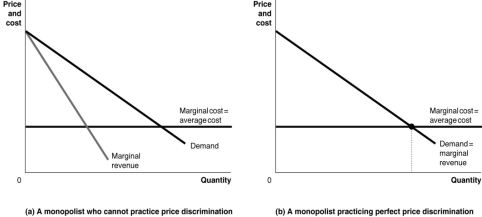
-Refer to Figure 9.16.Graph (a)represents a monopolist who cannot price discriminate and graph (b)represents a monopolist practicing perfect price discrimination.On each graph, identify the monopoly price, the monopoly output, the efficient output, and the areas representing profit, consumer surplus, and deadweight loss.
__________________________________________________________________________________________________________________________________________________________________________________________
Correct Answer:
Verified
View Answer
Unlock this answer now
Get Access to more Verified Answers free of charge
Q148: A successful strategy of price discrimination requires
Q150: One reason why McDonald's charges a single
Q157: To successfully price discriminate, a firm must
Q166: The airline industry routinely engages in price
Q169: What is yield management? How is yield
Q177: What is the difference between price discrimination
Q178: Are restaurant coupons a form of price
Q179: Why is it necessary for a firm
Q180: Book publishers use price discrimination routinely, but
Q265: Because each customer pays according to her
Unlock this Answer For Free Now!
View this answer and more for free by performing one of the following actions

Scan the QR code to install the App and get 2 free unlocks

Unlock quizzes for free by uploading documents