Multiple Choice
Figure 10.4 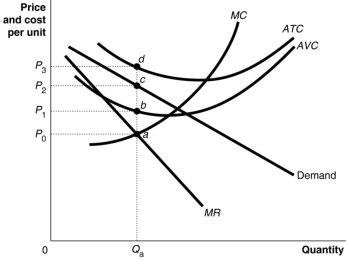 Figure 10.4 shows short-run cost and demand curves for a monopolistically competitive firm in the market for designer watches.
-Refer to Figure 10.4.The area that represents the total fixed cost of production is
A) 0P1aQa
B) P0adP3
C) P1bdP3
D) That information cannot be determined from the graph.
Correct Answer:
Verified
Related Questions

