Figure 10.18 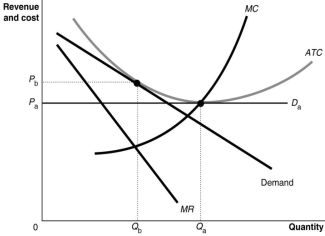
-Refer to Figure 10.18.The diagram demonstrates that
A) in the short run, the monopolistic competitor produces an output Qb, but in the long run after it adjusts its capacity, it will produce the allocatively efficient output, Qa.
B) it is not possible for a monopolistic competitor to produce the productively efficient output level, Qa, because of product differentiation.
C) it is possible for a monopolistic competitor to produce the productively efficient output level, Qa, if it is willing to lower its price from Pb to Pa.
D) in the long run, the monopolistic competitor produces the minimum-cost output level, Qa, but in the short run its output of Qb is not cost minimising.
Correct Answer:
Verified
Q190: Figure 10.18 Q191: Figure 10.17 Q193: It is true in both monopolistically competitive Q196: In the long run, firms in both Q197: Excess capacity is a characteristic of monopolistically Q198: In contrast with perfect competition, excess capacity Q206: Long-run equilibrium in a monopolistically competitive market Q212: Monopolistically competitive firms have downward-sloping demand curves.In Q216: Only one of the following statements is Q219: In long-run equilibrium, compared to a perfectly![]()
![]()
Unlock this Answer For Free Now!
View this answer and more for free by performing one of the following actions

Scan the QR code to install the App and get 2 free unlocks

Unlock quizzes for free by uploading documents