Figure 15.5 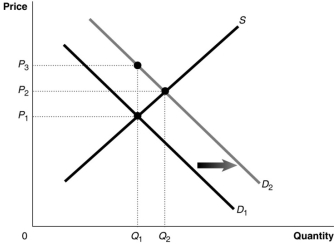 Figure 15.5 shows a market with an externality.The current market equilibrium output of Q1 is not the economically efficient output.The economically efficient output is Q2.
-Refer to Figure 15.5.Suppose the current market equilibrium output of Q1 is not the economically efficient output because of an externality.The economically efficient output is Q2.In that case, diagram shows
A) the effect of a subsidy granted to producers of a good.
B) the effect of an excess demand in a market.
C) the effect of a positive externality in the consumption of a good.
D) the effect of a negative externality in the consumption of a good.
Correct Answer:
Verified
Q42: Figure 15.5 Q42: When there is a positive externality, Q43: Figure 15.4 Q44: Figure 15.5 Q44: The cost borne by a producer in Q46: An external cost is created when you Unlock this Answer For Free Now! View this answer and more for free by performing one of the following actions Scan the QR code to install the App and get 2 free unlocks Unlock quizzes for free by uploading documents![]()
A) the![]()
![]()
A)graduate

