Figure 15.14 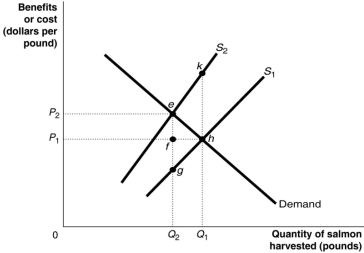 Figure 15.14 shows the market for Atlantic tuna, a common resource.The current market equilibrium output of Q1 is not the economically efficient output.The economically efficient output is Q2.
-Refer to Figure 15.14.The current market equilibrium output is partly the result of overfishing.In that case, what does S1 represent?
A) The private marginal cost of harvesting tuna
B) The social marginal cost of harvesting tuna
C) The private marginal benefit of harvesting tuna
D) The social marginal benefit of harvesting tuna
Correct Answer:
Verified
Q173: Which of the following displays these two
Q174: The marginal social benefit curve is a
Q176: Figure 15.14 Q179: An example of a quasi-public good is Q180: One difference between the demand for a Q181: The efficient output level of a public Q182: Which of the following is an example Q210: In economics, the term "free rider" refers Q212: The market demand for a public good Q233: The basic cause of deadweight losses from![]()
A)crime
Unlock this Answer For Free Now!
View this answer and more for free by performing one of the following actions

Scan the QR code to install the App and get 2 free unlocks

Unlock quizzes for free by uploading documents