Figure 16.5 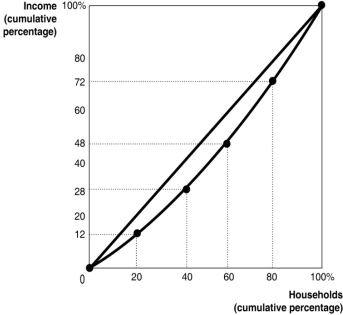 Figure 16.5 shows the Lorenz curve for a hypothetical country.
-Refer to Figure 16.5.The highest 40 per cent of households
A) earn 24 per cent of the society's total income.
B) earn 28 per cent of the society's total income.
C) earn 48 per cent of the society's total income.
D) earn 72 per cent of the society's total income.
Correct Answer:
Verified
Q112: Figure 16.6 Q113: Which of the following summarises the information Q115: Figure 16.6 Q116: Holding all other factors constant, income earned Q118: A Lorezo curve illustrates Q119: The poverty rate is defined as the Q231: All Gini coefficients must lie between 0 Q244: What is a Lorenz curve and what Q252: What is the difference between the poverty Q255: Income inequality increases as the Gini coefficient![]()
![]()
A)a comparison of the
Unlock this Answer For Free Now!
View this answer and more for free by performing one of the following actions

Scan the QR code to install the App and get 2 free unlocks

Unlock quizzes for free by uploading documents