Use the following to answer questions :
Figure 17-1 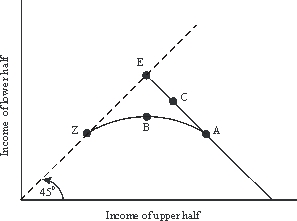
-In Figure 17-1, cost of redistribution is best represented by:
A) shortfall of A below E.
B) shortfall of ABZ below AE.
C) a regression from E back to A.
D) any and all of the above.
E) none of the above.
Correct Answer:
Verified
Q32: In calculating Lorenz curves, economists have found
Q33: The computation of the poverty line:
A)is based
Q34: Use the following to answer questions :
Figure
Q35: Poverty in contemporary America can be explained
Q36: Among the leaks that Okun noted is:
A)the
Q38: The percentage of total income earned by
Q39: Use the following to answer questions :
Figure
Q40: Use the following to answer questions :
Figure
Q41: Lorenz curves drawn closer to the 45
Q42: Statistics show that in 2006 the median
Unlock this Answer For Free Now!
View this answer and more for free by performing one of the following actions

Scan the QR code to install the App and get 2 free unlocks

Unlock quizzes for free by uploading documents