Refer to the figure below. Which would be the diagram of a mixed cost?
A) Graph A
B) Graph B
C) Graph C
D) Graph D 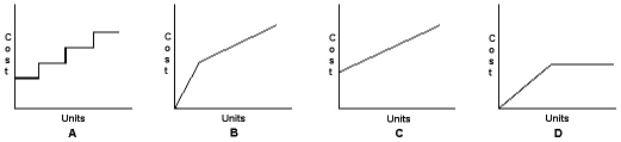
Correct Answer:
Verified
Q33: Exhibit 21-2 The following cost data are
Q34: Wimmer Company makes swimming suits and
Q35: When using the scattergraph method to analyze
Q36: Mosely Company's per-unit cost is the same
Q37: Another name for the scattergraph method of
Q39: Which of the following is the formula
Q40: Which of the following is the formula
Q41: If total sales are $460,000, total variable
Q42: Exhibit 21-3 The following partial income statement
Q43: If a company has a positive contribution
Unlock this Answer For Free Now!
View this answer and more for free by performing one of the following actions

Scan the QR code to install the App and get 2 free unlocks

Unlock quizzes for free by uploading documents