Exhibit 21-6 The graph below illustrates various cost behavior patterns in XYZ Company.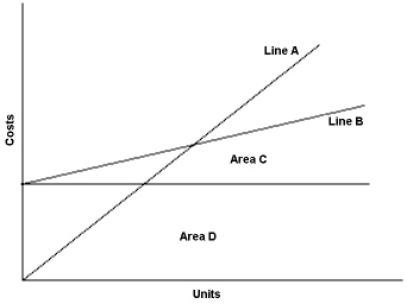
-Refer to Exhibit 21-6. In the graph above, total costs are represented by:
A) Line A
B) Line B
C) Area C
D) Area D
Correct Answer:
Verified
Q98: When other factors remain constant, a decrease
Q99: Inner Corporation sells space heaters. The contribution
Q100: Anderson Corporation sells picture calendars for $10
Q101: Exhibit 21-7 Use the cost-volume-profit graph below
Q102: Everclean Company cleans draperies. It charges $90
Q104: A company's break-even point would change if
Q105: Increasing the selling price and decreasing sales
Q106: As fixed costs increase, the break-even point
Q107: Exhibit 21-7 Use the cost-volume-profit graph below
Q108: Exhibit 21-7 Use the cost-volume-profit graph below
Unlock this Answer For Free Now!
View this answer and more for free by performing one of the following actions

Scan the QR code to install the App and get 2 free unlocks

Unlock quizzes for free by uploading documents