Exhibit 21-6 The graph below illustrates various cost behavior patterns in XYZ Company.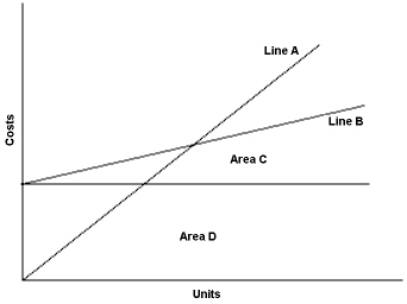
-Refer to Exhibit 21-6. In the graph above, the variable costs are represented by:
A) Line A
B) Line B
C) Area C
D) Area D
Correct Answer:
Verified
Q104: A company's break-even point would change if
Q105: Increasing the selling price and decreasing sales
Q106: As fixed costs increase, the break-even point
Q107: Exhibit 21-7 Use the cost-volume-profit graph below
Q108: Exhibit 21-7 Use the cost-volume-profit graph below
Q110: Exhibit 21-7 Use the cost-volume-profit graph below
Q111: Company X and Company Y each have
Q112: Exhibit 21-6 The graph below illustrates various
Q113: At a break-even point of 600 units
Q114: Collins Co. earned a profit of $2,000
Unlock this Answer For Free Now!
View this answer and more for free by performing one of the following actions

Scan the QR code to install the App and get 2 free unlocks

Unlock quizzes for free by uploading documents