Exhibit 21-8 Use the profit graph below to answer the following question(s) .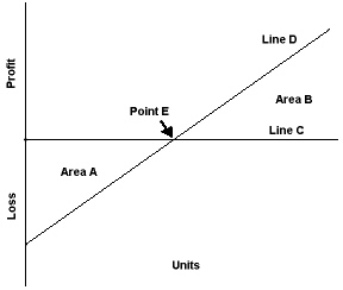
-Refer to Exhibit 21-8. Area A on the profit graph represents the:
A) Profit area
B) Total costs
C) Loss area
D) Break-even point
Correct Answer:
Verified
Q128: As compared to a company with a
Q129: Johnston Co. sells three products with the
Q130: Sales mix refers to:
A) The differing volumes
Q131: Maintaining low fixed costs and high variable
Q132: McCammon Co. sells three products with the
Q134: Exhibit 21-9 Stella Signs sells two different
Q135: Operating leverage deals primarily with the relationship
Q136: One method that a multi-product firm can
Q137: Which of the following types of firms
Q138: Operating leverage is:
A) The proportion of total
Unlock this Answer For Free Now!
View this answer and more for free by performing one of the following actions

Scan the QR code to install the App and get 2 free unlocks

Unlock quizzes for free by uploading documents