This graph demonstrates the domestic demand and supply for a good,as well as a quota and the world price for that good. 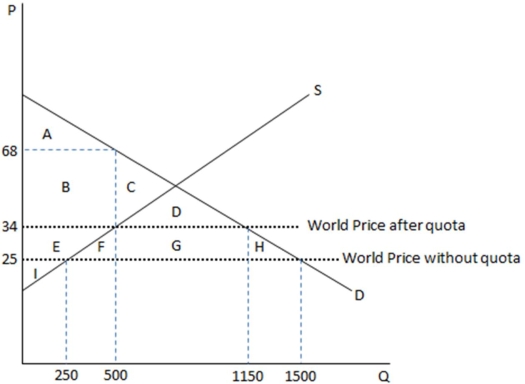 According to the graph shown,if the government restricts free trade,area G represents:
A) quota rents, which go to domestic producers.
B) quota rents, which go to foreign firms or governments.
C) government tax revenues, which go to the domestic government.
D) government tax revenues, which go to the foreign government.
Correct Answer:
Verified
Q124: The World Trade Organization (WTO)is an international
Q125: Americans whose jobs have been lost to
Q127: Import standards on specific countries are:
A) more
Q128: This graph demonstrates the domestic demand and
Q130: When a nation imposes a blanket standard
Q131: As a general rule,free trade:
A) increases the
Q132: The fair trade movement:
A) attempts to inform
Q133: The problem of inconsistent standards across nations
Q134: Every government has its own set of
Q142: Import standards on specific countries usually address
Unlock this Answer For Free Now!
View this answer and more for free by performing one of the following actions

Scan the QR code to install the App and get 2 free unlocks

Unlock quizzes for free by uploading documents