Multiple Choice
 If the graph shown is displaying a competitive labor market:
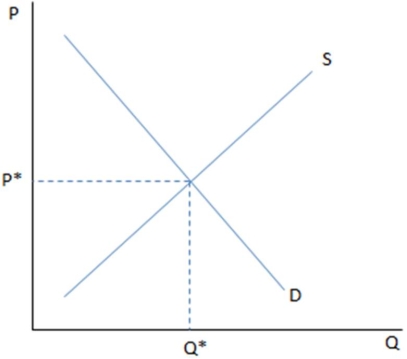
A) S would represent an individual worker's supply of labor at each wage.
B) S would represent the firm's supply of jobs at each wage.
C) P* would represent the equilibrium wage.
D) Q* would represent the equilibrium wage.
Correct Answer:
Verified
Related Questions
Q109: If producers who hire labor in a
Q110: Q111: Increased border patrol will affect the labor Q111: In a competitive labor market, if the Q112: In a competitive labor market,if the demand Unlock this Answer For Free Now! View this answer and more for free by performing one of the following actions Scan the QR code to install the App and get 2 free unlocks Unlock quizzes for free by uploading documents![]()

