This graph shows three different budget constraints: A,B,and C. 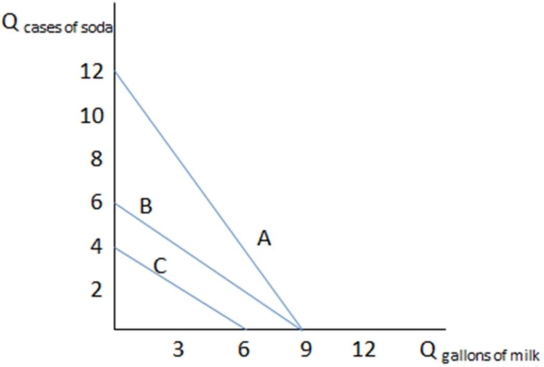 If Larry has budget constraint B in the graph shown,what is his opportunity cost of one gallon of milk?
A) It is 6 cases of soda.
B) It is exactly one case of soda.
C) It is less than one case of soda.
D) It is more than one case of soda.
Correct Answer:
Verified
Q77: Q78: Q79: Q80: Q81: This graph shows three different budget constraints: Q83: Rational utility maximizing consumers tend to: Q84: When a person's income increases: Q85: This graph shows three different budget constraints: Q86: This graph shows three different budget constraints: Q87: This graph shows three different budget constraints: Unlock this Answer For Free Now! View this answer and more for free by performing one of the following actions Scan the QR code to install the App and get 2 free unlocks Unlock quizzes for free by uploading documents![]()
![]()
![]()
![]()
A) buy
A) more bundles

