Multiple Choice
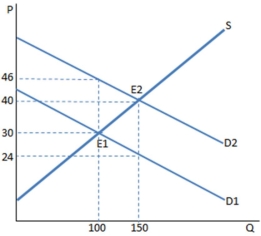 The graph shown best represents which of the following?
A) A tax on sellers
B) A subsidy to sellers
C) A price floor.
D) A subsidy to buyers
Correct Answer:
Verified
Related Questions
Q116: Q117: Does a tax on sellers affect the Q118: Q119: Does a tax on sellers affect the Q120: Q122: If the demand curve is less elastic Q123: Q124: If the supply curve is more inelastic Q125: Tax incidence: Q126: Unlock this Answer For Free Now! View this answer and more for free by performing one of the following actions Scan the QR code to install the App and get 2 free unlocks Unlock quizzes for free by uploading documents![]()
![]()
![]()
![]()
A) depends on the relative elasticity![]()

