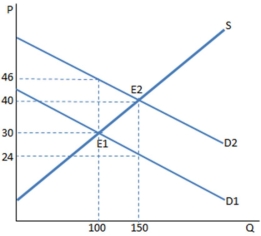
 The graph shown portrays a subsidy to buyers.The subsidy causes:
A) 50 more units to be sold in this market.
B) 150 more units to be sold in this market.
C) 100 fewer units to be sold in this market.
D) 50 fewer units to be sold in this market.
Correct Answer:
Verified
Q137: If the demand curve is more elastic
Q138: Policymakers who wish to discourage businesses that
Q139: Q140: If the producers bear a larger portion Q141: The government is deciding where to put Q143: Does a subsidy to sellers affect the Q144: Would you expect a tax on cigarettes Q145: Does a subsidy to buyers affect the![]()
Unlock this Answer For Free Now!
View this answer and more for free by performing one of the following actions

Scan the QR code to install the App and get 2 free unlocks

Unlock quizzes for free by uploading documents