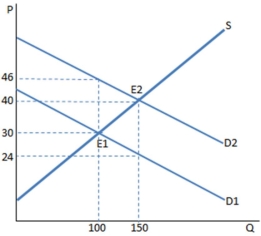
 The graph shown portrays a subsidy to buyers.Once the subsidy is in place,the buyers pay _____ and the sellers receive ________; the difference is ___________.
A) $24; $40; the amount of the subsidy
B) $30; $46; the amount of the subsidy
C) $40; $24; the amount of the subsidy
D) $24; $40; the amount of government revenue
Correct Answer:
Verified
Q144: Would you expect a tax on cigarettes
Q145: Does a subsidy to buyers affect the
Q146: Q147: Who actually benefits from a subsidy to Q148: Does a subsidy to sellers affect the Q150: Who benefits from a subsidy to buyers? Q151: Does a subsidy to buyers affect the Q152: Is it possible for sellers to benefit Q153: If the government wants to encourage the Q154: ![]()
A)![]()
Unlock this Answer For Free Now!
View this answer and more for free by performing one of the following actions

Scan the QR code to install the App and get 2 free unlocks

Unlock quizzes for free by uploading documents