Multiple Choice
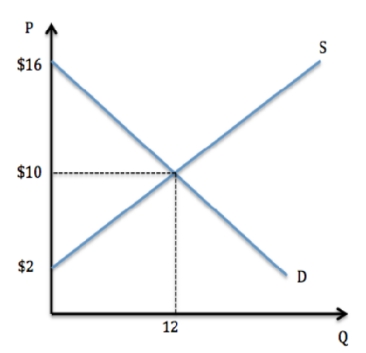 According to the graph shown,producer surplus is:
A) the area under the demand curve and above the market price.
B) the area under the supply curve and above the price.
C) the area above the supply curve and below the price.
D) the area above the demand curve and below the price.
Correct Answer:
Verified
Related Questions

