This graph depicts the demand for a normal good. 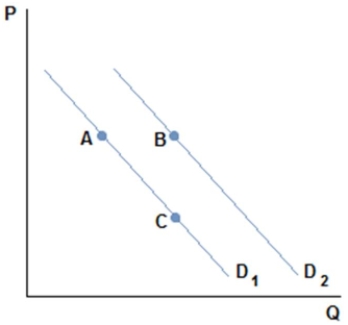 A shift from A to B in the graph shown might be caused by:
A) a decrease in the price of a substitute.
B) a decrease in the price of a complement.
C) an increase in the price of a complement.
D) an increase in the good's price.
Correct Answer:
Verified
Q57: John just won the Megamillions jackpot.We can
Q58: The latest news report stated that the
Q59: After getting a raise at work,Jennie now
Q60: An increase in the price of Heinz
Q61: Demand for Shell gasoline will increase if
Q62: Which of the following would not affect
Q63: Ray's company just announced that everyone will
Q64: The price of dog collars has gone
Q65: The price of house paint,a normal good,has
Q66: There has been an increase in the
Unlock this Answer For Free Now!
View this answer and more for free by performing one of the following actions

Scan the QR code to install the App and get 2 free unlocks

Unlock quizzes for free by uploading documents