Multiple Choice
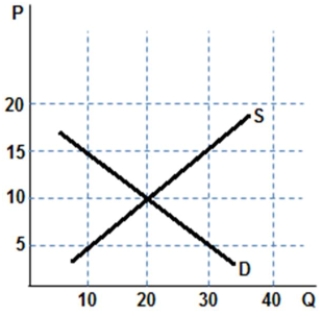 According to the graph shown,at a price of $5,there is a:
A) shortage of 10.
B) shortage of 20.
C) shortage of 30.
D) surplus of 20.
Correct Answer:
Verified
Related Questions
According to the graph shown,at a price of $5,there is a:
A) shortage of 10.
B) shortage of 20.
C) shortage of 30.
D) surplus of 20.
Correct Answer:
Verified

