Figure 21.2 shows the benefit functions for low-ability workers and high-ability workers (A and B) ,along with one indifference curve for each worker type (C and D) .The employer cannot observe worker type directly but has created two positions,E and F,as a screening mechanism.The equilibrium shown here is: 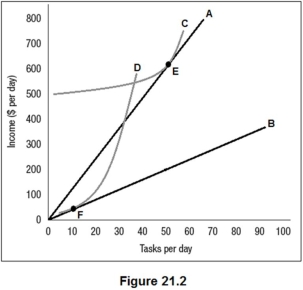
A) a separating equilibrium.
B) a pooling equilibrium.
C) a market unraveling equilibrium.
D) an example of adverse selection.
Correct Answer:
Verified
Q41: Which of the following explains why a
Q42: If homes owned by real estate agents
Q43: Figure 21.2 shows the benefit functions for
Q44: Figure 21.2 shows the benefit functions for
Q45: Moral hazard is _ in employment settings
Q47: Moral hazard occurs if one party to
Q48: A salesperson works for a car dealership
Q49: A salesperson works for a car dealership
Q50: _ has occurred if the manager of
Q51: When one party to a transaction takes
Unlock this Answer For Free Now!
View this answer and more for free by performing one of the following actions

Scan the QR code to install the App and get 2 free unlocks

Unlock quizzes for free by uploading documents