Refer to Figure 8.2.Which graph illustrates an output expansion path with an increasing capital-labor ratio? 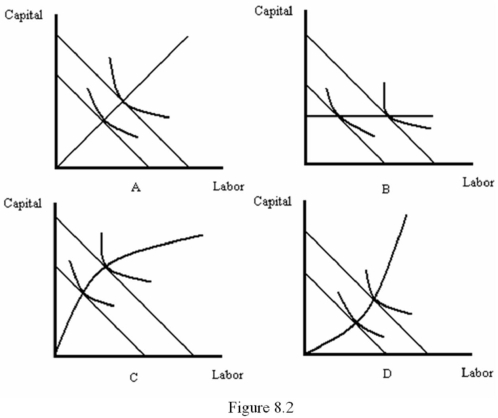
A) A
B) B
C) C
D) D
Correct Answer:
Verified
Q27: Refer to Figure 8.3.What is the average
Q28: Refer to Figure 8.2.Which graph illustrates an
Q29: Whenever a firm uses input X but
Q30: _ refers to the output level at
Q31: Refer to Table 8.1.Assume the wage rate
Q33: Suppose that MPL = 50 and MPK
Q34: A firm's _ shows the least-cost input
Q35: Suppose that MPL = 100 and MPK
Q36: Suppose a firm has a Cobb-Douglas weekly
Q37: Refer to Table 8.1.Assume the wage rate
Unlock this Answer For Free Now!
View this answer and more for free by performing one of the following actions

Scan the QR code to install the App and get 2 free unlocks

Unlock quizzes for free by uploading documents