Refer to Figure 6.6.What area represents the compensation for reduced consumption that results from an increase in the price of gasoline from $1.75 to $3.00 per gallon? 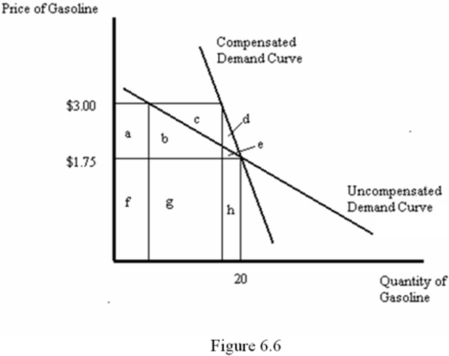
A) a + b
B) a + b + e
C) c + d + e
D) d + e
Correct Answer:
Verified
Q46: Which of the following best describes labor
Q47: A Marshallian,or uncompensated,demand curve reflects:
A) only the
Q48: Refer to Figure 6.6.What area represents the
Q49: When income effects are small:
A) there is
Q50: If a good is inferior,then whenever the
Q52: The amount of money actually received in
Q53: Which of the following statements is true,assuming
Q54: Refer to Figure 6.5.The substitution effect is
Q55: Refer to Figure 6.5.By how many hours
Q56: Suppose a consumer's nominal income is $50,000
Unlock this Answer For Free Now!
View this answer and more for free by performing one of the following actions

Scan the QR code to install the App and get 2 free unlocks

Unlock quizzes for free by uploading documents