Refer to Figure 6.6.What area represents the compensation for an increase in the price of gasoline from $1.75 to $3.00 per gallon? 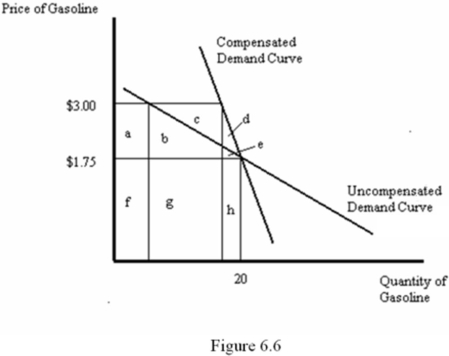
A) a + b + c + d + e
B) f + g + h
C) a + b + c
D) d + e
Correct Answer:
Verified
Q43: A demand curve that shows the relationship
Q44: For a normal good,the income and substitution
Q45: A consumer's _ determines the location of
Q46: Which of the following best describes labor
Q47: A Marshallian,or uncompensated,demand curve reflects:
A) only the
Q49: When income effects are small:
A) there is
Q50: If a good is inferior,then whenever the
Q51: Refer to Figure 6.6.What area represents the
Q52: The amount of money actually received in
Q53: Which of the following statements is true,assuming
Unlock this Answer For Free Now!
View this answer and more for free by performing one of the following actions

Scan the QR code to install the App and get 2 free unlocks

Unlock quizzes for free by uploading documents