Refer to Figure 5.1.In which graph does a shift from BL1 to BL2 represent an increase in the consumer's income? 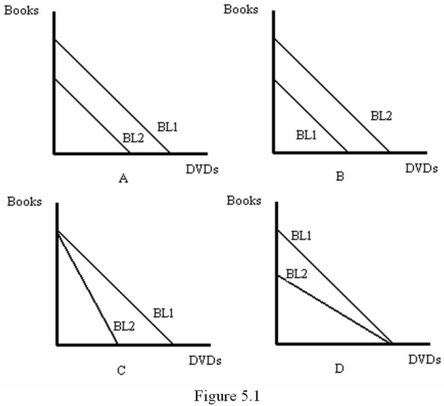
A) A
B) B
C) C
D) D
Correct Answer:
Verified
Q13: An increase in a consumer's income will
Q14: When the consumer has found the best
Q15: A consumer's budget constraint is determined by:
A)
Q16: The price of bread is $1.50 per
Q17: Refer to Figure 5.3.Which of the following
Q19: Refer to Figure 5.1.In which graph could
Q20: Suppose a consumer buys pizza (P)and soft
Q21: An affordable consumption bundle is an interior
Q22: Boundary solutions arise when:
A) a good provides
Q23: A curve that describes the relationship between
Unlock this Answer For Free Now!
View this answer and more for free by performing one of the following actions

Scan the QR code to install the App and get 2 free unlocks

Unlock quizzes for free by uploading documents