Refer to Figure 5.6.Which diagram shows an increase in income with both bread and soup being normal goods? 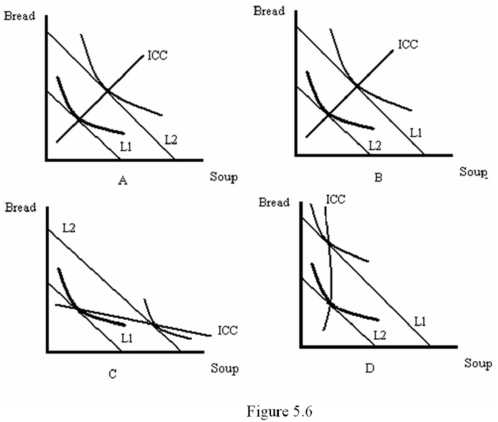
A) A
B) B
C) C
D) D
Correct Answer:
Verified
Q41: If a change in the price of
Q42: A curve that describes the relationship between
Q43: Refer to Figure 5.7.Which diagram best represents
Q44: If the price of the good measured
Q45: If two goods are substitutes,then an increase
Q47: If a good is normal,then the Engel
Q48: When a good is normal:
A) an increase
Q49: Refer to Figure 5.7.Which diagram best represents
Q50: Refer to Figure 5.6.Which diagram shows an
Q51: If the price of the good measured
Unlock this Answer For Free Now!
View this answer and more for free by performing one of the following actions

Scan the QR code to install the App and get 2 free unlocks

Unlock quizzes for free by uploading documents