Refer to Figure 4.3.Which diagram most likely represents the indifference map for Sony PlayStations and Nintendo GameCubes? 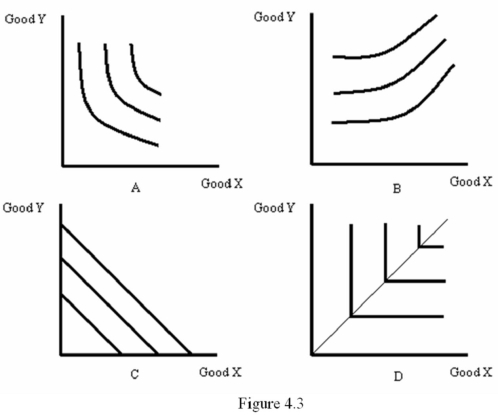
A) A
B) B
C) C
D) D
Correct Answer:
Verified
Q27: Higher rates of substitution are indicated by
Q28: Suppose a consumer's MRS is given by
Q29: Which of the following would be inconsistent
Q30: Refer to Figure 4.3.Which diagram most likely
Q31: The slope of an indifference curve tells
Q33: Rates of substitution are determined by:
A) the
Q34: Refer to Figure 4.2.The marginal rate of
Q35: For any given family of indifference curves,a
Q36: A "bad" would be associated with:
A) zero
Q37: Suppose Joe's MRS for cookies with crackers
Unlock this Answer For Free Now!
View this answer and more for free by performing one of the following actions

Scan the QR code to install the App and get 2 free unlocks

Unlock quizzes for free by uploading documents