Refer to Figure 3.1.If one of the graphs represents the total cost of an activity,which other graph best represents the marginal cost of the activity? 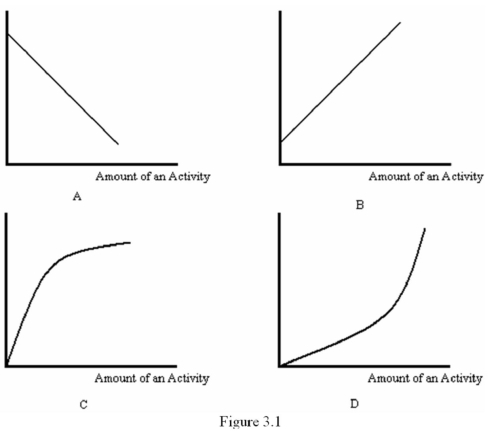
A) A
B) B
C) C
D) D
Correct Answer:
Verified
Q1: The cost associated with foregoing the opportunity
Q2: Refer to Table 3.1.Suppose that you have
Q3: Refer to Table 3.2,which shows some costs
Q5: Opportunity cost refers to:
A) the amount of
Q6: Total benefits minus total cost equals:
A) gross
Q7: Refer to Table 3.2,which shows some costs
Q8: Refer to Table 3.2,which shows some costs
Q9: Refer to Table 3.2,which shows some costs
Q10: Refer to Table 3.2,which shows some costs
Q11: Refer to Table 3.1.Suppose that you have
Unlock this Answer For Free Now!
View this answer and more for free by performing one of the following actions

Scan the QR code to install the App and get 2 free unlocks

Unlock quizzes for free by uploading documents