Exhibit 3-11 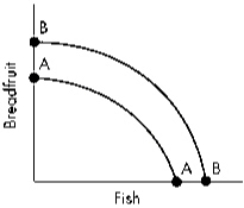 Refer to Exhibit 3-11.Which of the following would most likely cause the production possibilities curve for breadfruit and fish to shift from AA to BB?
A) a reduction in the size of the available labor force
B) choosing to produce more fish and less breadfruit
C) choosing to produce more breadfruit and fewer fish
D) additions to the stock of capital
Correct Answer:
Verified
Q82: Which of the following concepts are illustrated
Q100: Exhibit 3-7 Q102: Exhibit 3-10 Q105: Along a production possibilities curve that is Q106: Which of the following will shift the Q106: Refer to the figure below.Which of the Unlock this Answer For Free Now! View this answer and more for free by performing one of the following actions Scan the QR code to install the App and get 2 free unlocks Unlock quizzes for free by uploading documents![]()
![]()

