Exhibit 3-11 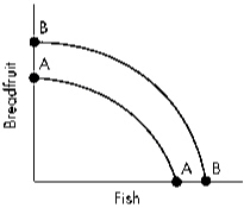 Refer to Exhibit 3-11.Which of the following best explains how the society producing breadfruit and fish depicted above could have moved from curve AA to curve BB?
A) The society reallocated its resources toward catching a greater number of fish.
B) The society reallocated its resources toward the production of a greater quantity of breadfruit.
C) A new school of fish was located.
D) The society experienced significant immigration of labor.
Correct Answer:
Verified
Q101: When more resources in an economy are
Q103: A decrease in the unemployment rate from
Q104: Which of the following will not shift
Q107: When economic growth occurs it will:
A)eventually eliminate
Q108: Approximately two decades after a "baby boom,"
Q109: Which of the following would be likely
Q111: An increase in the unemployment rate from
Q114: Assume the economy moves from a situation
Q120: Which of the following would not shift
Q120: Exhibit 3-12 ![]()
Unlock this Answer For Free Now!
View this answer and more for free by performing one of the following actions

Scan the QR code to install the App and get 2 free unlocks

Unlock quizzes for free by uploading documents