Multiple Choice
Exhibit 5-1 The diagram below represents the market for butter. 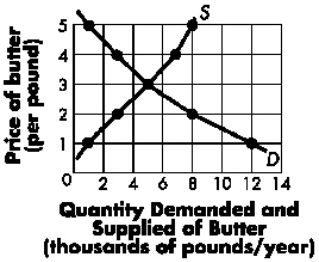 Refer to Exhibit 5-1.If a price ceiling of $2 is imposed,____ units of butter will be sold.
A) 8,000
B) 5,000
C) 4,000
D) 3,000
Correct Answer:
Verified
Related Questions
Q47: If the price of ice cream increases
Q49: A safety report is released that contends

