Multiple Choice
Exhibit 6-3 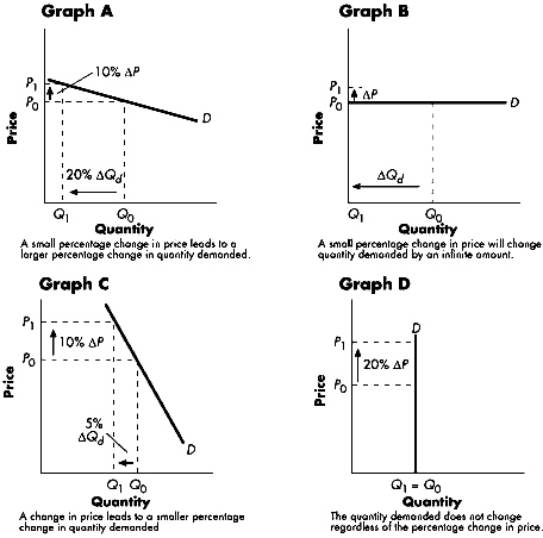 Refer to Exhibit 6-3.The graph that best illustrates a relatively inelastic (but not perfectly inelastic) demand curve is:
A) Graph A.
B) Graph B.
C) Graph C.
D) Graph D.
Correct Answer:
Verified
Related Questions
Q47: Exhibit 6-2 Q50: The price elasticity of demand coefficient for Q51: Exhibit 6-2 Q55: Which of the following is not a Unlock this Answer For Free Now! View this answer and more for free by performing one of the following actions Scan the QR code to install the App and get 2 free unlocks Unlock quizzes for free by uploading documents![]()
![]()

