Exhibit 14-5 The graph depicts a monopolistically competitive firm's demand,marginal revenue,and cost curves. 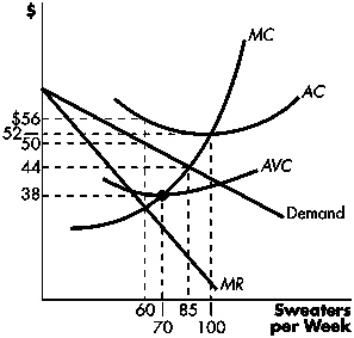 Refer to Exhibit 14-5.If the firm produces the profit-maximizing (or loss-minimizing) level of output,it will produce:
A) 100 sweaters each week.
B) 85 sweaters each week.
C) 70 sweaters each week.
D) 60 sweaters each week.
Correct Answer:
Verified
Q79: Exhibit 14-2 The following diagram depicts monopolistically
Q80: As firms exit a monopolistically competitive market,profits
Q81: Exhibit 14-2 The following diagram depicts monopolistically
Q82: Exhibit 14-3 The following diagrams depict firms
Q83: The graph illustrates a firm in long-run
Q85: Exhibit 14-4 The following diagram depicts firms
Q86: Exhibit 14-4 The following diagram depicts firms
Q87: If the firm in the graph below
Q88: Exhibit 14-5 The graph depicts a monopolistically
Q89: Exhibit 14-2 The following diagram depicts monopolistically
Unlock this Answer For Free Now!
View this answer and more for free by performing one of the following actions

Scan the QR code to install the App and get 2 free unlocks

Unlock quizzes for free by uploading documents