Exhibit 14-5 The graph depicts a monopolistically competitive firm's demand,marginal revenue,and cost curves. 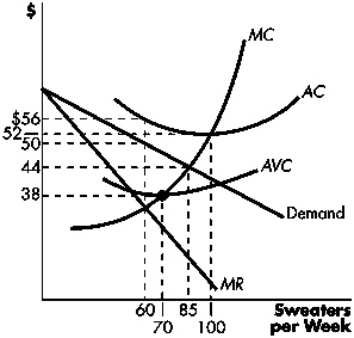 Refer to Exhibit 14-5.Based on the diagram,it follows that:
A) new firms will enter the industry.
B) existing firms will exit the industry.
C) the firm is operating in long-run equilibrium.
D) the firm could minimize average cost by producing 85 sweaters each week.
Correct Answer:
Verified
Q91: If the firm in the graph below
Q92: If a profit-maximizing monopolistic competitor earns positive
Q93: Exhibit 14-5 The graph depicts a monopolistically
Q94: Exhibit 14-4 The following diagram depicts firms
Q95: Exhibit 14-4 The following diagram depicts firms
Q97: Exhibit 14-3 The following diagrams depict firms
Q98: Exhibit 14-4 The following diagram depicts firms
Q99: Exhibit 14-5 The graph depicts a monopolistically
Q100: If the firm in the graph below
Q101: In a monopolistically competitive scenario,the demand curve
Unlock this Answer For Free Now!
View this answer and more for free by performing one of the following actions

Scan the QR code to install the App and get 2 free unlocks

Unlock quizzes for free by uploading documents