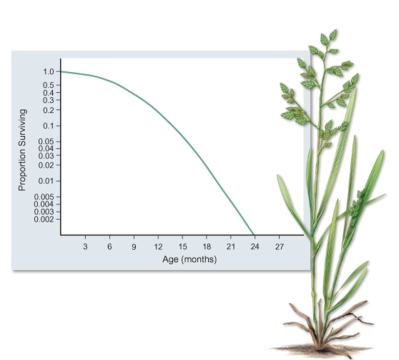
What is the most reasonable conclusion that can be made from data graphed in the figure. 
A) After high mortality early in life,survivorship becomes constant for the rest of life.
B) After high mortality late in life,survivorship becomes constant for the rest of life.
C) After high mortality early in life,survivorship increases at a constant rate for the rest of life.
D) After high mortality late in life,survivorship increases at a constant rate for the rest of life.
E) After high mortality early in life,survivorship decreases at a constant rate for the rest of lifE.
Correct Answer:
Verified
Q43: Select the description of a population pyramid
Q47: Which one of the following expressions from
Q55: Population pyramids are primarily used to show
A)death
Q56: A _ would probably have a Type
Q57: At what point in a population will
Q58: Which one of the following is not
Q59: Some population parameters vary directly (as one
Q63: Most density-dependent factors show negative feedback relative
Q64: What is the most reasonable conclusion that
Q65: The figure included shows the body temperature
Unlock this Answer For Free Now!
View this answer and more for free by performing one of the following actions

Scan the QR code to install the App and get 2 free unlocks

Unlock quizzes for free by uploading documents